plot划线问题
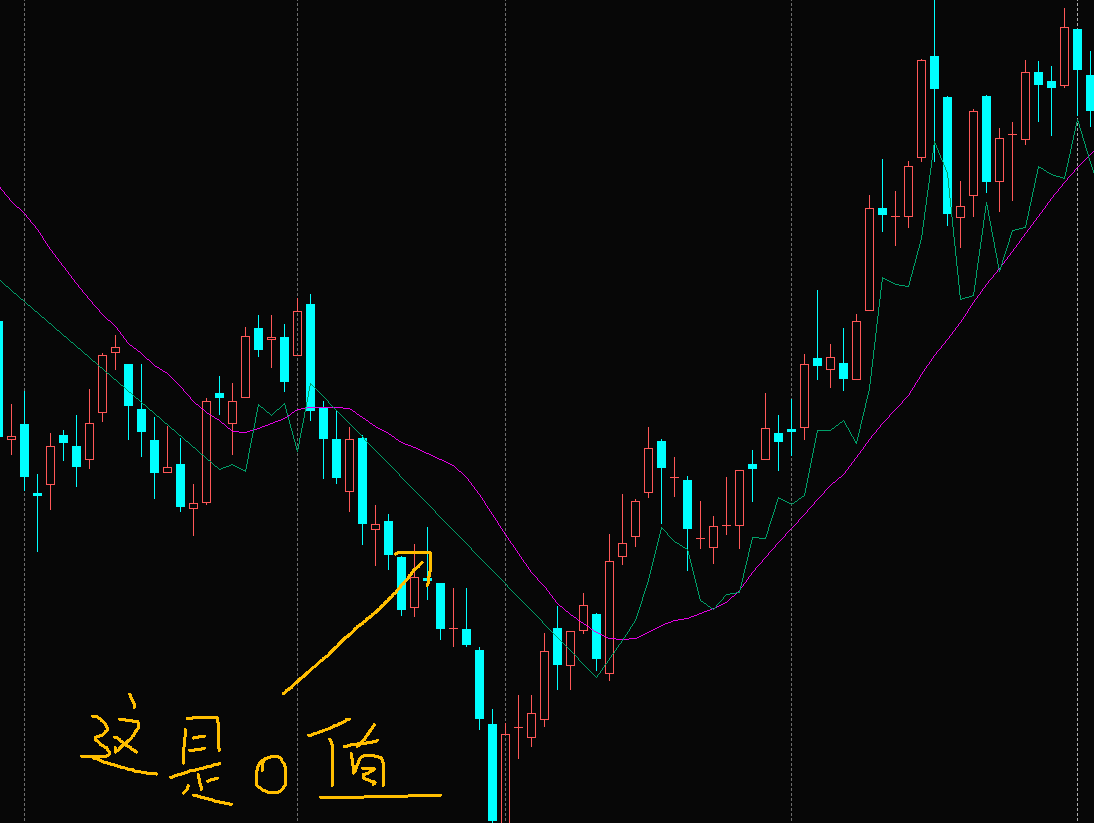
我的需求是这样的,如果价格在均线上方,用收盘价减去14周期ATR,并且画一条线;
但是,为什么均线下方也会显示这条线呢?
atr = AvgTrueRange(14);
if(Close[1] > shortMa[1])
{
PlotNumeric(UPATR,Close[1] -atr);
}
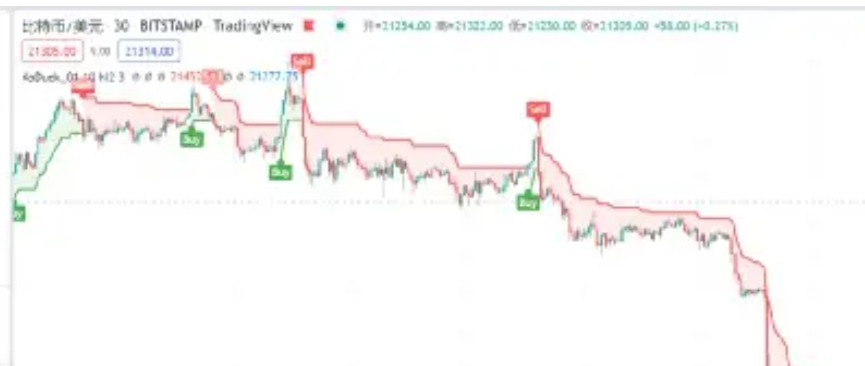
其实我是想做一个类似,超级趋势那样的指标,可以画中断的线;
https://www.tbquant.net/helper?navigate=tbquant&words=%E5%B1%9E%E6%80%A7&cid=901
4.8 “line-break”-画线段
4.8.1 定义
- 应用版本
- 属性名: \"line-break\"
- 属性表
4.8.2 示例
Vars
    Plot  plt1;
Events
    OnBar(ArrayRef<Integer> indexs)
    {
        if(currentBar%10 == 3){
           plt1.setOption(\"MA1\",\"line-break\",true);
        }
        plt1.line(\"MA1\",Close);
    }
我也是这样的需求,TB的函数不是太好用