求某合约N周期的最高点、最低点的连续折线,要求:如果极值点没有变化,则序列变量(序列变量必须连续的吗?)不赋值,有变化时需要赋值,如何实现,求各位大神不吝赐教,拜谢!
If (Highest(High[1], periodSingle) <>Highest(High[2], periodSingle))
{
highestCrest = Highest(High[1], periodSingle);
PlotAuto(\"highestCrest: \", highestCrest, 0, Red);
}
If (Lowest(Low[1], periodSingle), RN) <> Round(Lowest(Low[2], periodSingle))
{
lowestTrough = Lowest(Low[1], periodSingle);
PlotAuto(\"lowestTrough: \", lowestTrough, 0, Cyan);
}
Commentary(\"highestCrest: \" + Text(highestCrest));
Commentary(\"highestCrest[1]: \" + Text(highestCrest[1]));
Commentary(\"highestCrest[2]: \" + Text(highestCrest[2]));
Commentary(\"lowestTrough: \" + Text(lowestTrough));
Commentary(\"lowestTrough[1]: \" + Text(lowestTrough[1]));
Commentary(\"lowestTrough[2]: \" + Text(lowestTrough[2]));
结果仍然有相等的数值,即highestCrest = highestCrest[1] = highestCrest[2],为什么呢?
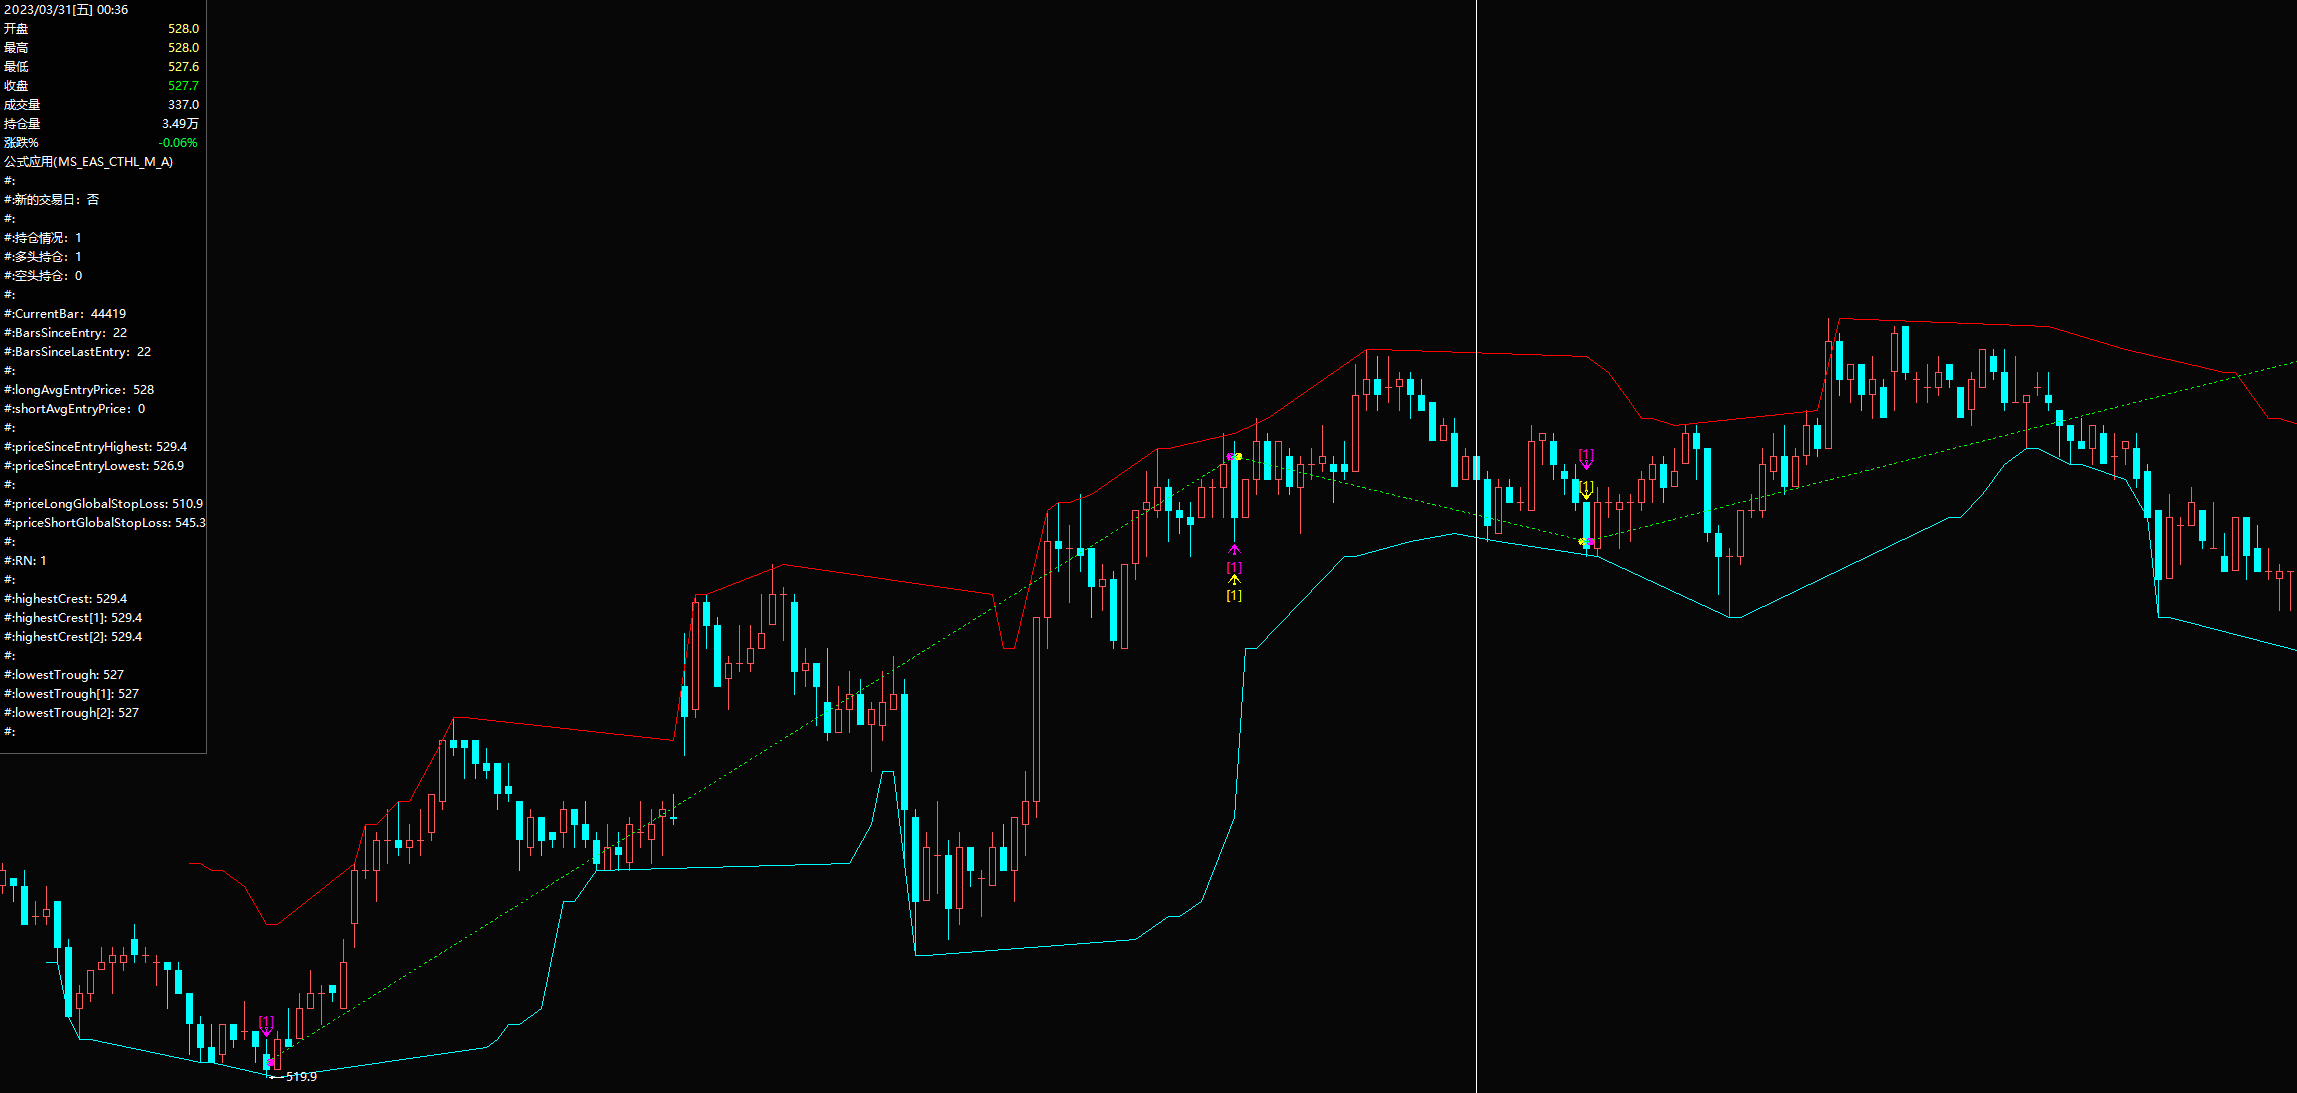
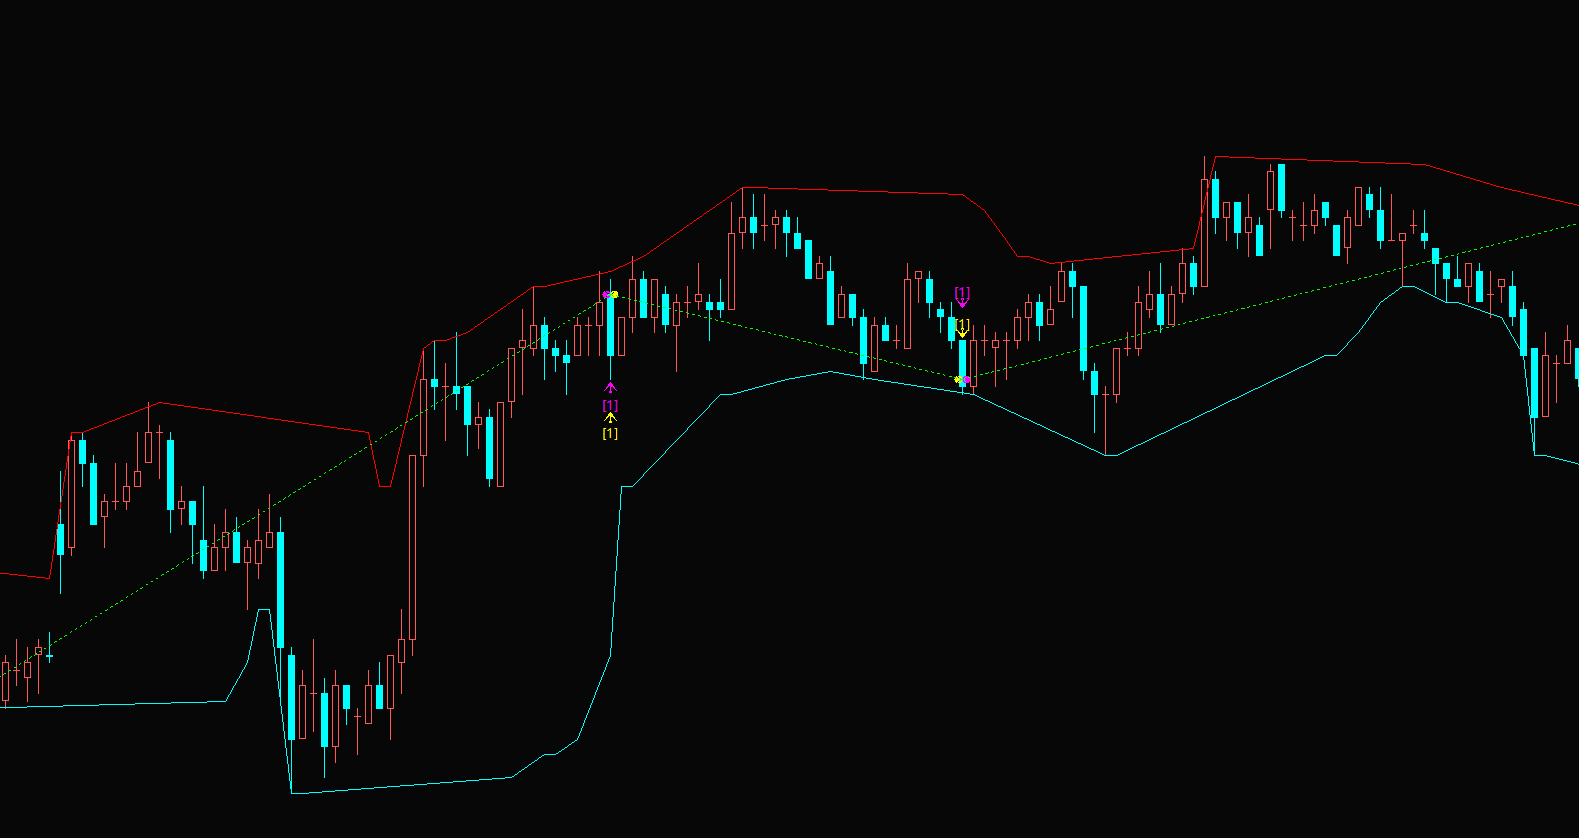
是一定周期内的极值点,如5周期15分钟的最高和最低点,由这些极值点分别连成的折线。
听不懂什么意思 极值点怎么还有变化 历史的极值点难道不是固定住的么