使用print确认包含unplot的分支进入并执行了
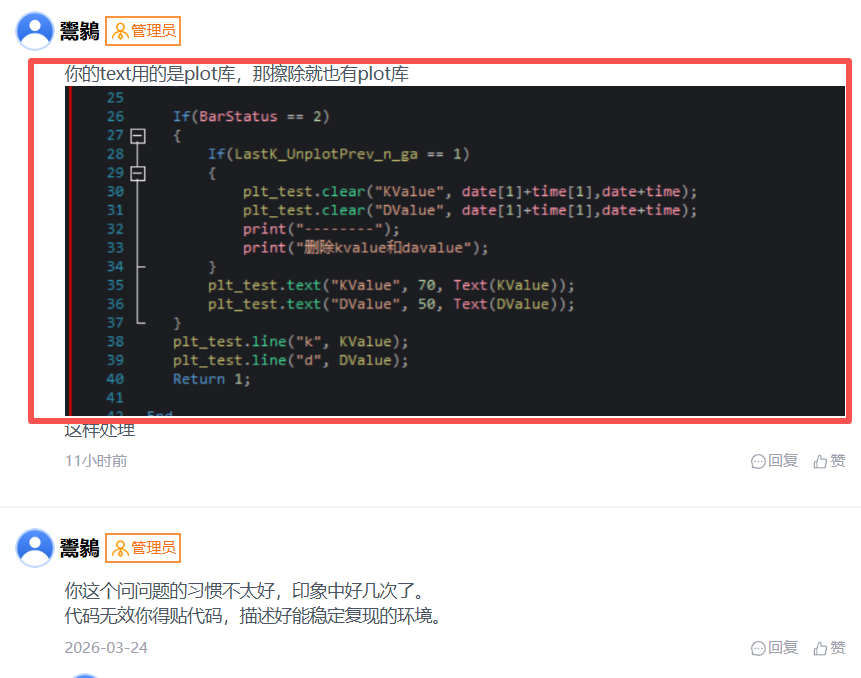
你的text用的是plot库,那擦除就也有plot库
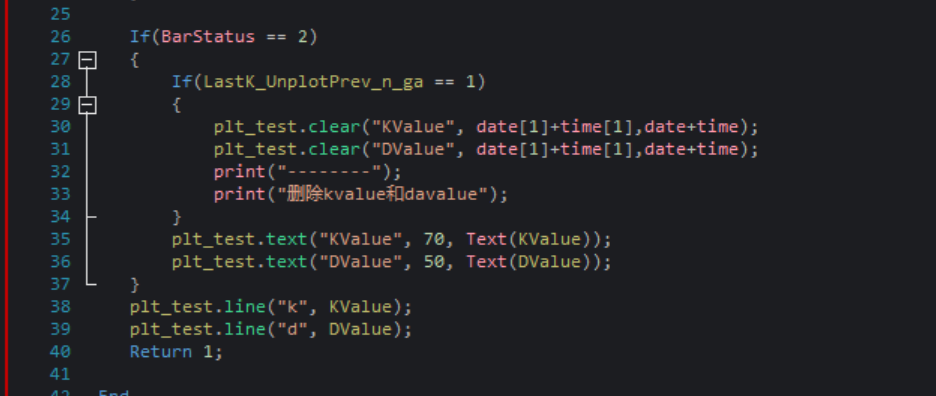
这样处理
好多 多谢老师!!
我试了用clear,效果还不如unplot,原来画的一个也没有去掉。这个unplot也没有返回值,不知道执行成功没有,现在只能使用土办法了,连续10个tick都在执行unplot,就能删除了。
我给你发的这个代码我是自己实盘里跑过的,效果没有问题,我不知道你说的效果不如unplot是什么意思。
你这个问问题的习惯不太好,印象中好几次了。
代码无效你得贴代码,描述好能稳定复现的环境。
不好意思哈
//------------------------------------------------------------------------

// 简称: testdemo

// 名称:

// 类别: 策略应用

// 类型: 用户应用

// 输出: Void

//------------------------------------------------------------------------

Params

   Numeric Length(14);

   Numeric SlowLength(3);

   Numeric SmoothLength(3);

Vars


   Series<Numeric> HighestValue;

   Series<Numeric> LowestValue;

   Series<Numeric> KValue;

   Numeric SumHLValue;

   Numeric SumCLValue;

   Numeric DValue;


   //此处添加变量

   Global Numeric dataid;

   Global Array<Numeric> LastK_UnplotPrev_n_ga;


   Plot plt_test;


Defs

   //此处添加策略函数


Events

   OnReady()

   {

       SetBackBarMaxCount(1+Max(Max(Length,SlowLength),SmoothLength));

       Range[0:DataSourceSize() - 1]

       {

           setPlotOption("K", "begin-bar", SlowLength);

           setPlotOption("D", "begin-bar", SmoothLength);

       }

   }


   //初始化事件函数,策略运行期间,首先运行且只有一次

   OnInit()

   {

       SubscribeBar(Symbol, "1m", BeginDateTime, EndDateTime);

       //SubscribeBar(Symbol, "60m", BeginDateTime, EndDateTime);


       SetArraySize(LastK_UnplotPrev_n_ga,DataCount,0);

       plt_test.setOption("margin-top", "0%");      // 设置作图区域上界限为画板的0%坐标处

       plt_test.setOption("margin-bottom", "-30%"); // 设置作图区域下界限为画板的-5%坐标处

       plt_test.setOption("x-format", "time");  // 设置X轴为时间轴


       setPlotOption("KValue", "color", Red);

       setPlotOption("DValue", "color", Green);


   }


   OnBarOpen(ArrayRef<Integer> indexes)

   {

       Range[dataid = 0: DataSourceSize() - 1 ]

       {

           LastK_UnplotPrev_n_ga[dataid] = 1;

       }

   }


   //Bar更新事件函数,参数indexs表示变化的数据源图层ID数组

   OnBar(ArrayRef<Integer> indexs)

   {

       Range[dataid = 0: DataSourceSize() - 1 ]

       {


           HighestValue = HighestFC(High, Length);

           LowestValue = LowestFC(Low, Length);

           SumHLValue = SummationFC(HighestValue-LowestValue,SlowLength);

           SumCLValue = SummationFC(Close - LowestValue,SlowLength);

           If(SumHLValue <> 0)

           {

               KValue = SumCLValue/SumHLValue*100;

           }Else

           {

               KValue = 0;

           }

           DValue = AverageFC(KValue,SmoothLength);


           testdemo(KValue,DValue,LastK_UnplotPrev_n_ga[dataid]);


           LastK_UnplotPrev_n_ga[dataid] = 0;

       }

   }


//------------------------------------------------------------------------

// 编译版本    2026/3/24 172801

// 版权所有    tbj2423361012

// 更改声明    TradeBlazer Software保留对TradeBlazer平台

//            每一版本的TradeBlazer策略修改和重写的权利

//------------------------------------------------------------------------


//------------------------------------------------------------------------

// 简称: testdemo

// 名称:

// 类别: 用户函数

// 类型: 用户函数

// 输出: 数值型

//------------------------------------------------------------------------

Params

   //此处添加参数

   Numeric KValue;

   Numeric DValue;

   Numeric LastK_UnplotPrev_n_ga;

Vars

   //此处添加变量


   Plot plt_test;


Begin


   If(CurrentBar == 0)

   {

       plt_test.setOption("margin-top", "0%");      // 设置作图区域上界限为画板的0%坐标处

       plt_test.setOption("margin-bottom", "-30%"); // 设置作图区域下界限为画板的-5%坐标处

       plt_test.setOption("x-format", "time");  // 设置X轴为时间轴


       setPlotOption("KValue", "color", Red);

       setPlotOption("DValue", "color", Green);

   }


   If(LastK_UnplotPrev_n_ga == 1)

   {

       Unplot("KValue", 1);

       Unplot("DValue", 1);

   }


   If(BarStatus == 2)

   {

       plt_test.text("KValue", 70, Text(KValue));

       plt_test.text("DValue", 50, Text(DValue));

   }

   plt_test.line("k", KValue);

   plt_test.line("d", DValue);


   Return 1;

End


//------------------------------------------------------------------------

// 编译版本    2026/3/24 175842

// 版权所有    tbj2423361012

// 更改声明    TradeBlazer Software保留对TradeBlazer平台

//            每一版本的TradeBlazer策略修改和重写的权利

//------------------------------------------------------------------------
以后记得用这个

否则要调整很多格式
好的 论坛发言比较少 不太了解。这个代码有什么问题吗?
不用代码模式,复制下来的代码就需要额外调整格式才能方便阅读
//------------------------------------------------------------------------
// 简称: testdemo
// 名称:
// 类别: 策略应用
// 类型: 用户应用
// 输出: Void
//------------------------------------------------------------------------
Params
Numeric Length(14);
Numeric SlowLength(3);
Numeric SmoothLength(3);
Vars
Series<Numeric> HighestValue;
Series<Numeric> LowestValue;
Series<Numeric> KValue;
Numeric SumHLValue;
Numeric SumCLValue;
Numeric DValue;
//此处添加变量
Global Numeric dataid;
Global Array<Numeric> LastK_UnplotPrev_n_ga;
Plot plt_test;
Defs
//此处添加策略函数
Events
OnReady()
{
SetBackBarMaxCount(1+Max(Max(Length,SlowLength),SmoothLength));
Range[0:DataSourceSize() - 1]
{
setPlotOption("K", "begin-bar", SlowLength);
setPlotOption("D", "begin-bar", SmoothLength);
}
}
//初始化事件函数,策略运行期间,首先运行且只有一次
OnInit()
{
SubscribeBar(Symbol, "1m", BeginDateTime, EndDateTime);
//SubscribeBar(Symbol, "60m", BeginDateTime, EndDateTime);
SetArraySize(LastK_UnplotPrev_n_ga,DataCount,0);
plt_test.setOption("margin-top", "0%"); // 设置作图区域上界限为画板的0%坐标处
plt_test.setOption("margin-bottom", "-30%"); // 设置作图区域下界限为画板的-5%坐标处
plt_test.setOption("x-format", "time"); // 设置X轴为时间轴
setPlotOption("KValue", "color", Red);
setPlotOption("DValue", "color", Green);
}
OnBarOpen(ArrayRef<Integer> indexes)
{
Range[dataid = 0: DataSourceSize() - 1 ]
{
LastK_UnplotPrev_n_ga[dataid] = 1;
}
}
//Bar更新事件函数,参数indexs表示变化的数据源图层ID数组
OnBar(ArrayRef<Integer> indexs)
{
Range[dataid = 0: DataSourceSize() - 1 ]
{
HighestValue = HighestFC(High, Length);
LowestValue = LowestFC(Low, Length);
SumHLValue = SummationFC(HighestValue-LowestValue,SlowLength);
SumCLValue = SummationFC(Close - LowestValue,SlowLength);
If(SumHLValue <> 0)
{
KValue = SumCLValue/SumHLValue*100;
}Else
{
KValue = 0;
}
DValue = AverageFC(KValue,SmoothLength);
testdemo(KValue,DValue,LastK_UnplotPrev_n_ga[dataid]);
LastK_UnplotPrev_n_ga[dataid] = 0;
}
}
//------------------------------------------------------------------------
// 编译版本 2026/3/24 172801
// 版权所有 tbj2423361012
// 更改声明 TradeBlazer Software保留对TradeBlazer平台
// 每一版本的TradeBlazer策略修改和重写的权利
//------------------------------------------------------------------------
//------------------------------------------------------------------------
// 简称: testdemo
// 名称:
// 类别: 用户函数
// 类型: 用户函数
// 输出: 数值型
//------------------------------------------------------------------------
Params
//此处添加参数
Numeric KValue;
Numeric DValue;
Numeric LastK_UnplotPrev_n_ga;
Vars
//此处添加变量
Plot plt_test;
Begin
If(CurrentBar == 0)
{
plt_test.setOption("margin-top", "0%"); // 设置作图区域上界限为画板的0%坐标处
plt_test.setOption("margin-bottom", "-30%"); // 设置作图区域下界限为画板的-5%坐标处
plt_test.setOption("x-format", "time"); // 设置X轴为时间轴
setPlotOption("KValue", "color", Red);
setPlotOption("DValue", "color", Green);
}
If(LastK_UnplotPrev_n_ga == 1)
{
Unplot("KValue", 1);
Unplot("DValue", 1);
}
If(BarStatus == 2)
{
plt_test.text("KValue", 70, Text(KValue));
plt_test.text("DValue", 50, Text(DValue));
}
plt_test.line("k", KValue);
plt_test.line("d", DValue);
Return 1;
End
//------------------------------------------------------------------------
// 编译版本 2026/3/24 175842
// 版权所有 tbj2423361012
// 更改声明 TradeBlazer Software保留对TradeBlazer平台
// 每一版本的TradeBlazer策略修改和重写的权利
//------------------------------------------------------------------------就这么一个简单的问题,你怎么万般刁难? 你们有什么要求,请全部一次性说清楚,别一会一个要求。另外,建议在论坛置顶发言要求,反复磋磨人有意思吗?
是不是后边还有什么另外的要求?
老师早就回复你了呀
你看看上面的评论
.........
代码都帮你写好了......
好的 多谢朋友
我万般刁难?我只是建议你发代码用代码模式,这样方便调试而已。上面修改建议早就发给你了