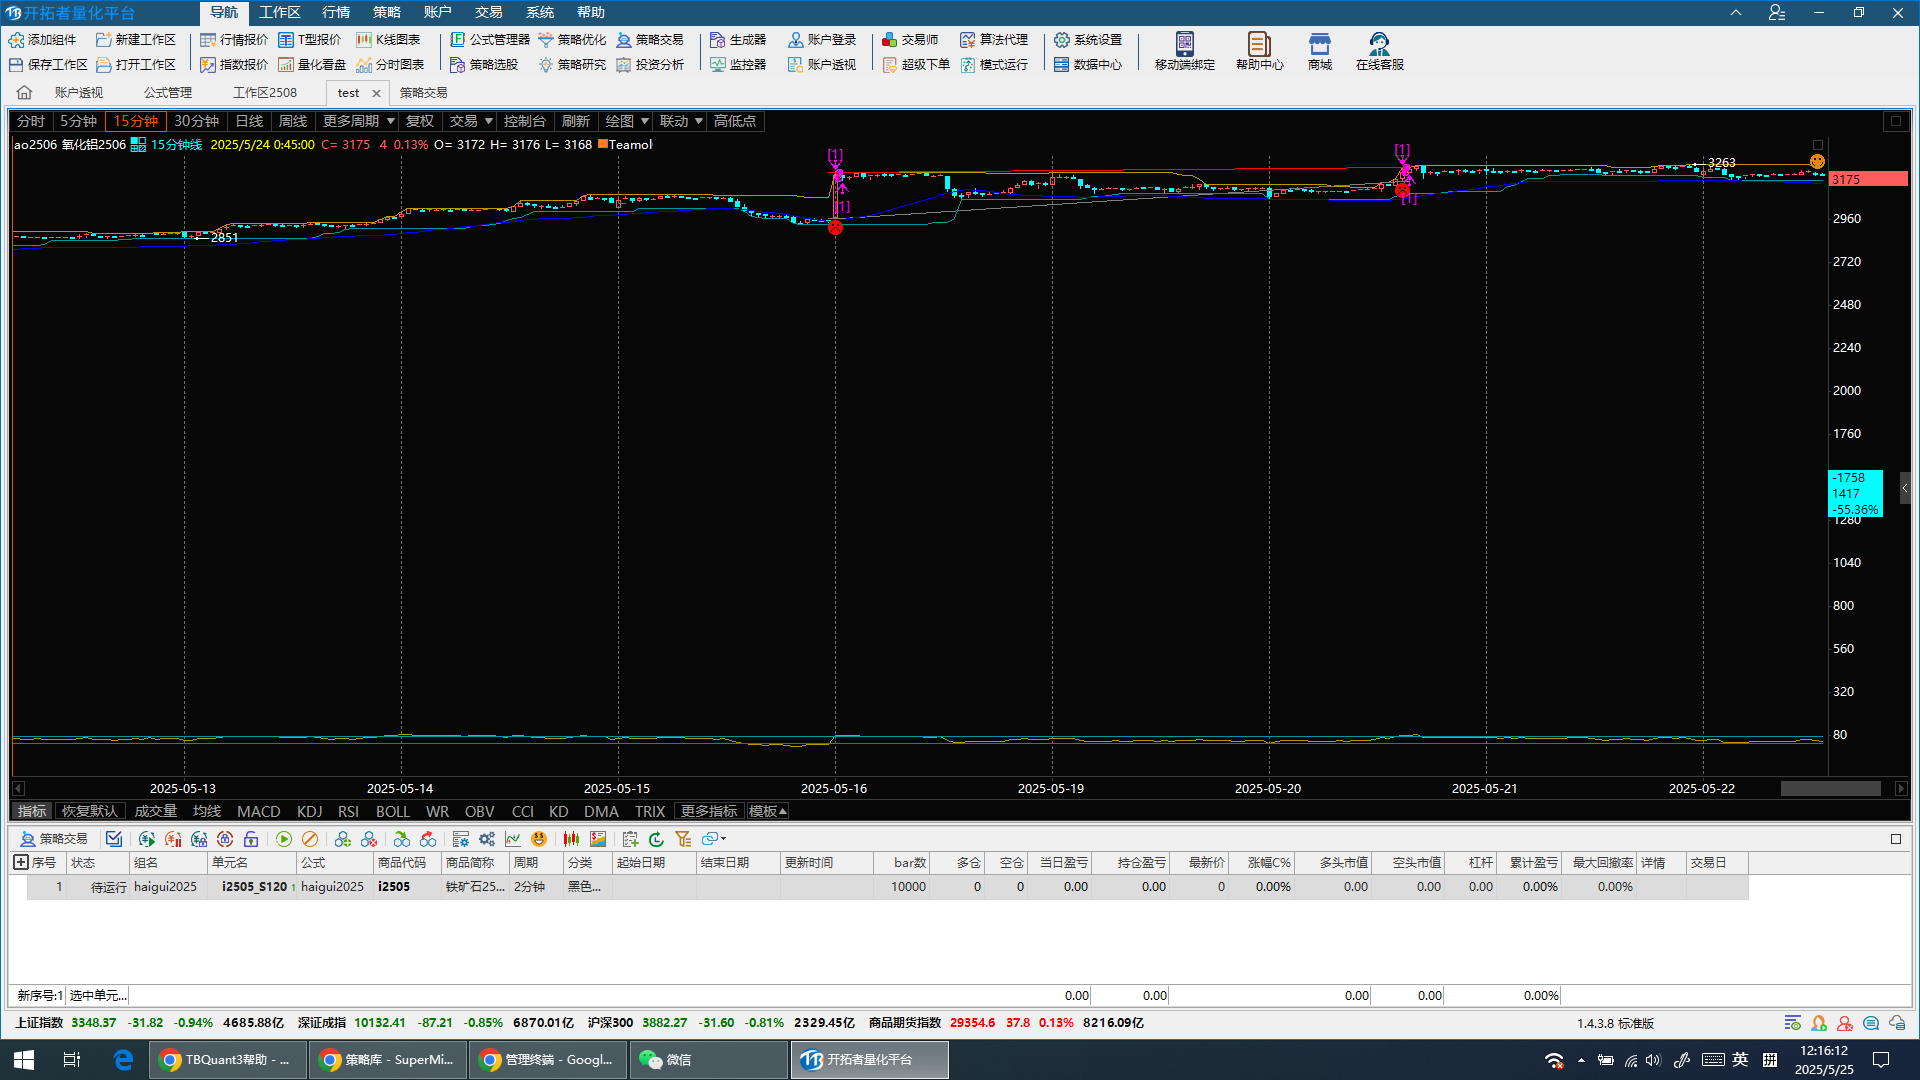
策略代码加入RSI部分,结果图层显示就变成下图一样,k线缩到上面去了,请问这个何解?
//Range[0:DataSourceSize() - 1]
If(1==1)
{
If(CurrentBar <= Length - 1)
{
NetChgAvg = ( Close - Close[Length] ) / Length ;
TotChgAvg = Average( Abs( Close - Close[1] ), Length ) ;
}Else
{
SF = 1/Length;
Change = Close - Close[1] ;
NetChgAvg = NetChgAvg[1] + SF * ( Change - NetChgAvg[1] ) ;
TotChgAvg = TotChgAvg[1] + SF * ( Abs( Change ) - TotChgAvg[1] ) ;
}
If( TotChgAvg <> 0 )
{
ChgRatio = NetChgAvg / TotChgAvg;
}else
{
ChgRatio = 0 ;
}
RSIValue = 50 * ( ChgRatio + 1 );
PlotNumeric("RSI",RSIValue);
PlotNumeric("超买",OverBought);
PlotNumeric("超卖",OverSold);
Commentary("LINE280-RSI,超买,超卖=" + Text(RSIValue) + "," + Text(OverBought) + "," + Text(OverSold));
}
嗯,quant右下角,改成子图显示
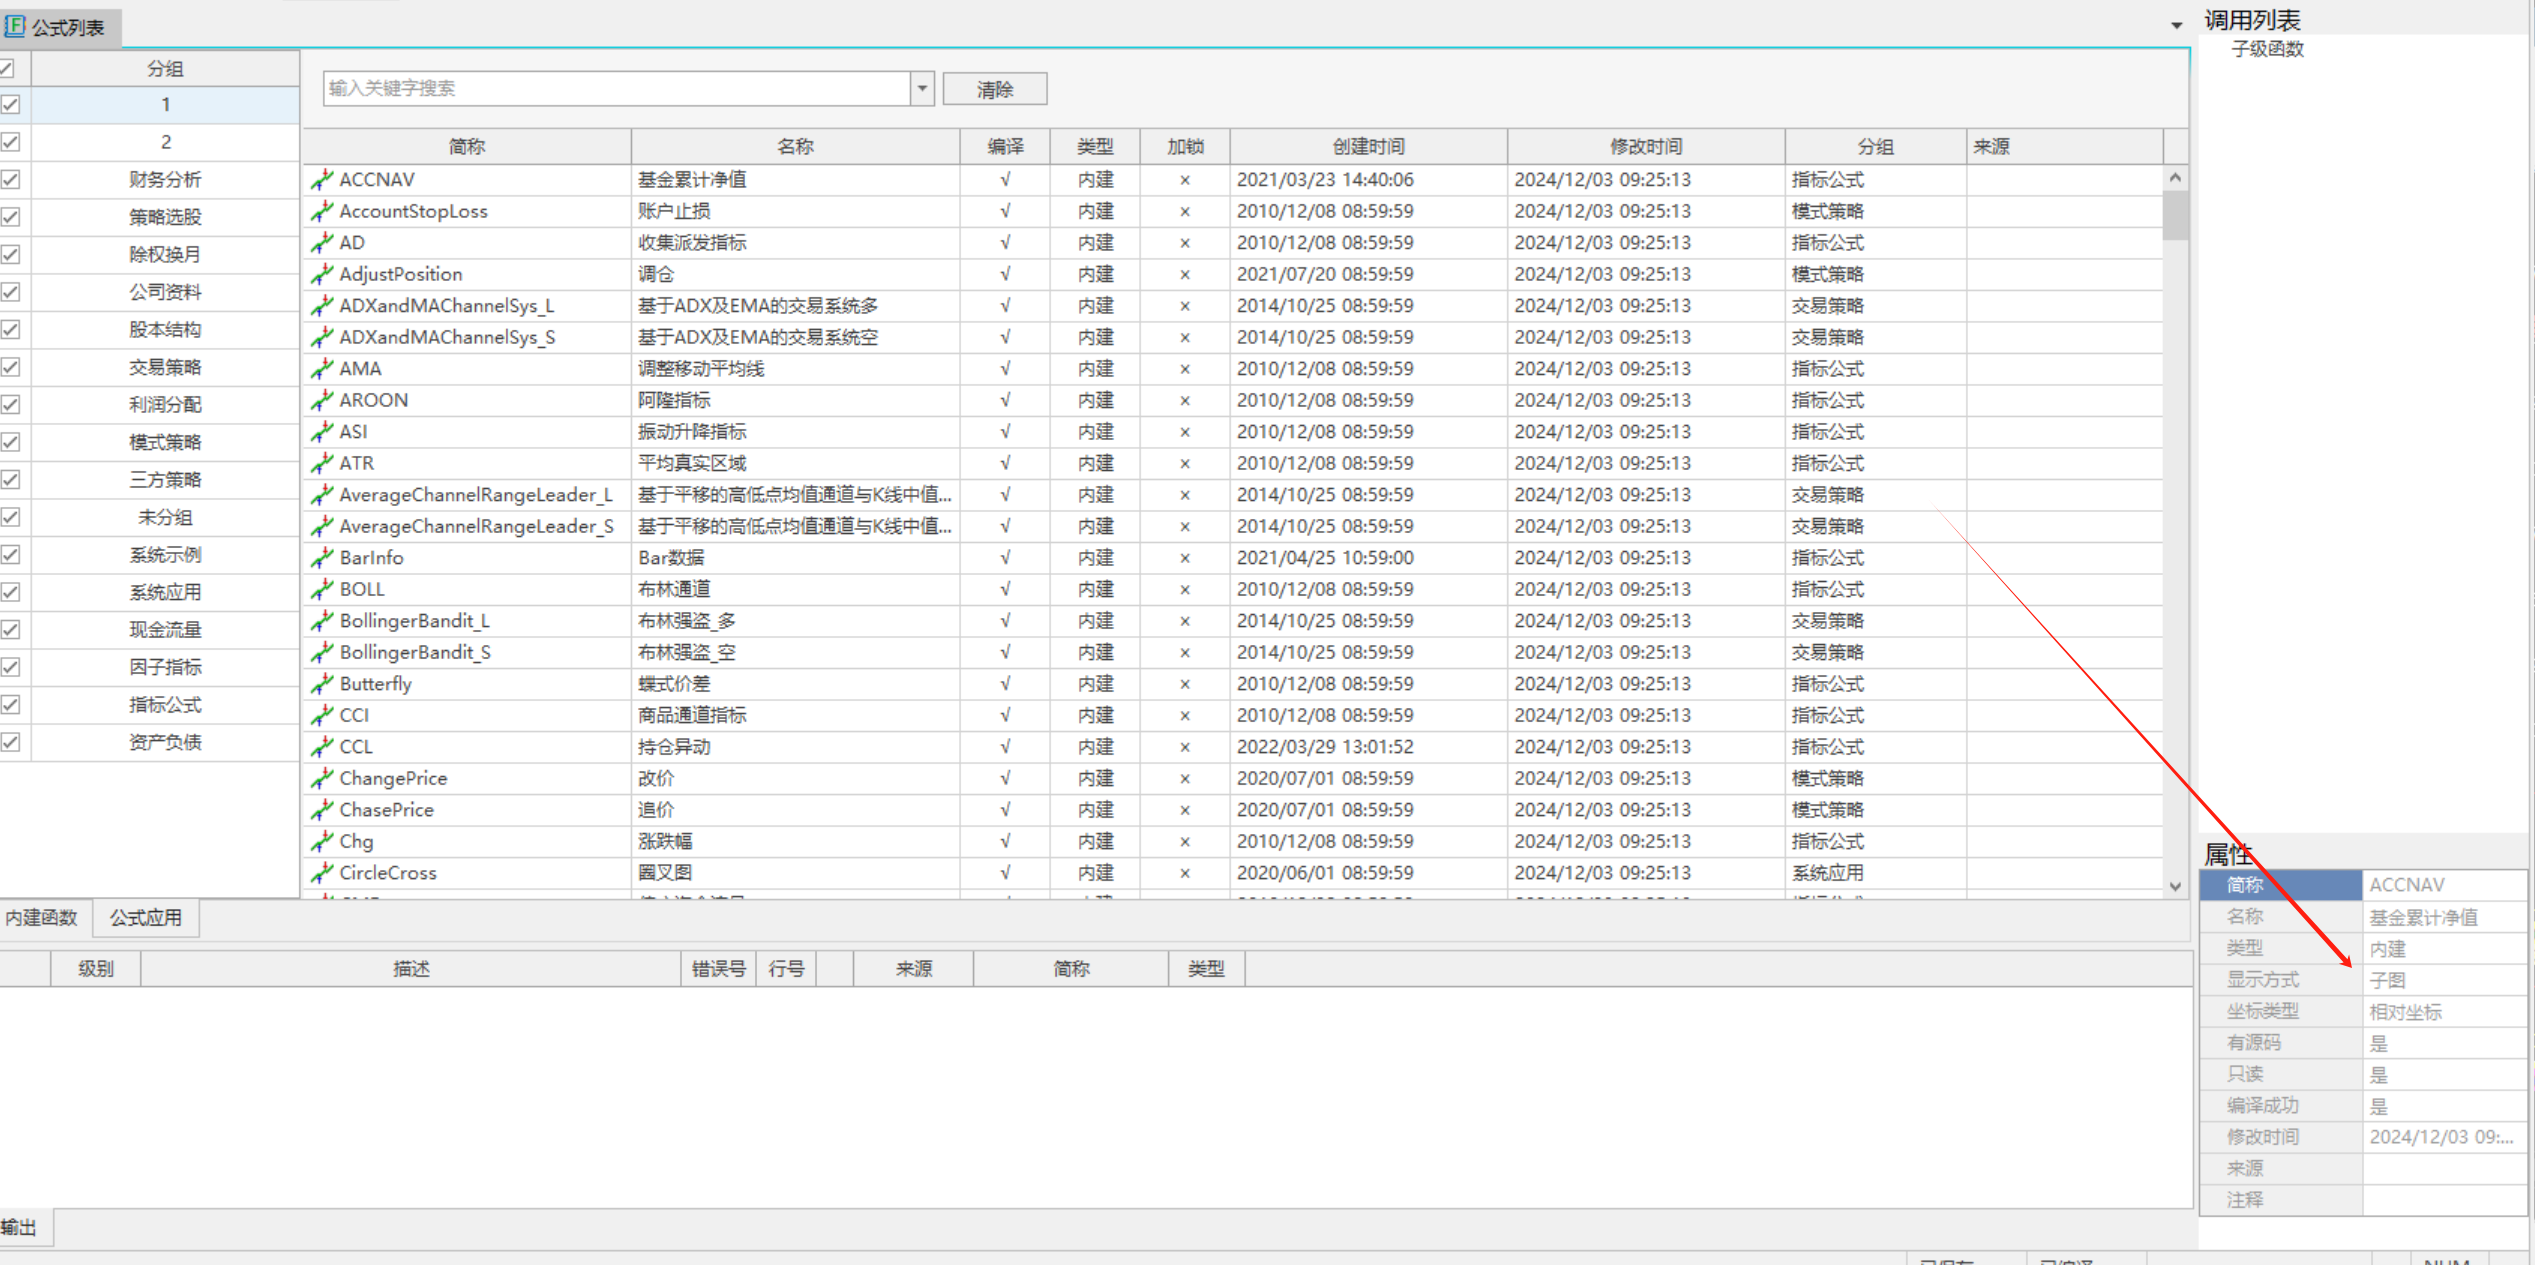
你画的副图 ,代码自己画到副图上,或者用设置勾选副图指标
左下角还是右下角来着
有个显示 “主图”改成 选“副图”