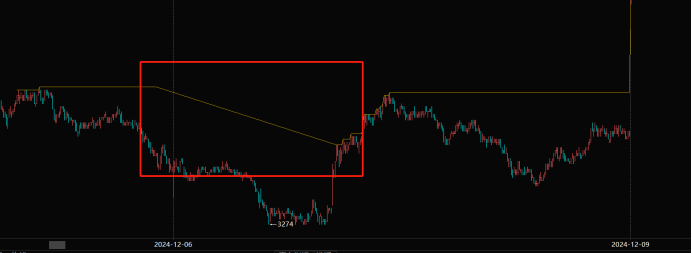
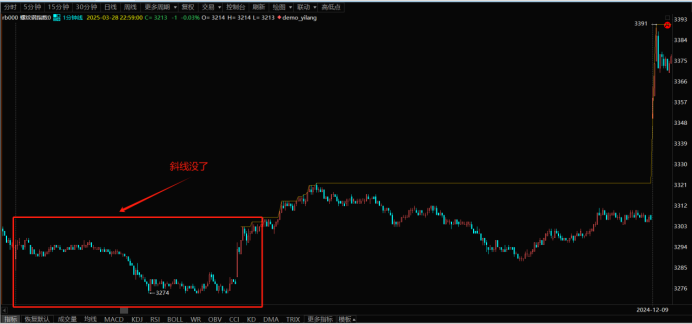
请教老师,我写了一段代码。(在图下面)
目的为:当日内趋势为上涨状态,且最大波幅大于20点时,在最高点画上轨道线。
但是在rb000上运行以后,发现在缩小时会出现斜线。
缩小出现斜线:


但是放大后斜线就没了,这是怎么回事?

代码:
Params
//此处添加参数
Vars
series<Numeric> bar_in_day;
series<Numeric> highest_in_day;
series<Numeric> lowest_in_day;
series<Numeric> AB_amplitude;
series<Numeric> A_point_index;
series<Numeric> B_point_index;
Defs
//此处添加公式函数
Events
//此处实现事件函数
//初始化事件函数,策略运行期间,首先运行且只有一次
OnInit()
{
}
//Bar更新事件函数,参数indexs表示变化的数据源图层ID数组
OnBar(ArrayRef<Integer> indexs)
{
If(TrueDate(0)<>TrueDate(1))
{
bar_in_day = 0;
highest_in_day = High;
lowest_in_day = low;
A_point_index = 0; //假设日内最低点为A,最高点为B。只看上涨的行情。
B_point_index = 0;
AB_amplitude = 0;
}
bar_in_day = bar_in_day+1;
//找出上涨行情最高点B点的bar索引
highest_in_day = Max(highest_in_day,High);
if(highest_in_day==High And high[0]>high[1])
{
B_point_index = bar_in_day;
}
//找出上涨行情最低点A点的bar索引
lowest_in_day = Min(lowest_in_day,low);
if(lowest_in_day==low)
{
A_point_index = bar_in_day;
}
//日内趋势为上涨状态,且最大波幅大于20点时,在最高点画上轨道线。
if(B_point_index>A_point_index ) //高点的bar索引在低点的bar索引后面,确定为上涨状态。
{
AB_amplitude = highest_in_day-lowest_in_day; //日内最大波幅
Commentary("日内最大波幅:"+text(AB_amplitude));
if(AB_amplitude>=20)
{
PlotNumeric("上轨道线",highest_in_day);
}
}
}
还是搜搜line-break
拉到下面有一个专门为tbquant设置的line-display字段
好的,回头看一下。目前遇到的问题太多,一个一个解决。
看了其它的帖子,找到问题所在了。
要用line-break才能画,而且我的老版TBquant好像不支持line-break设置,一运行就显示属性信息不存在。
同样的代码在TBquant3上运行就没问题,能达到效果。