如何将tbquant上的策略转换成python代码
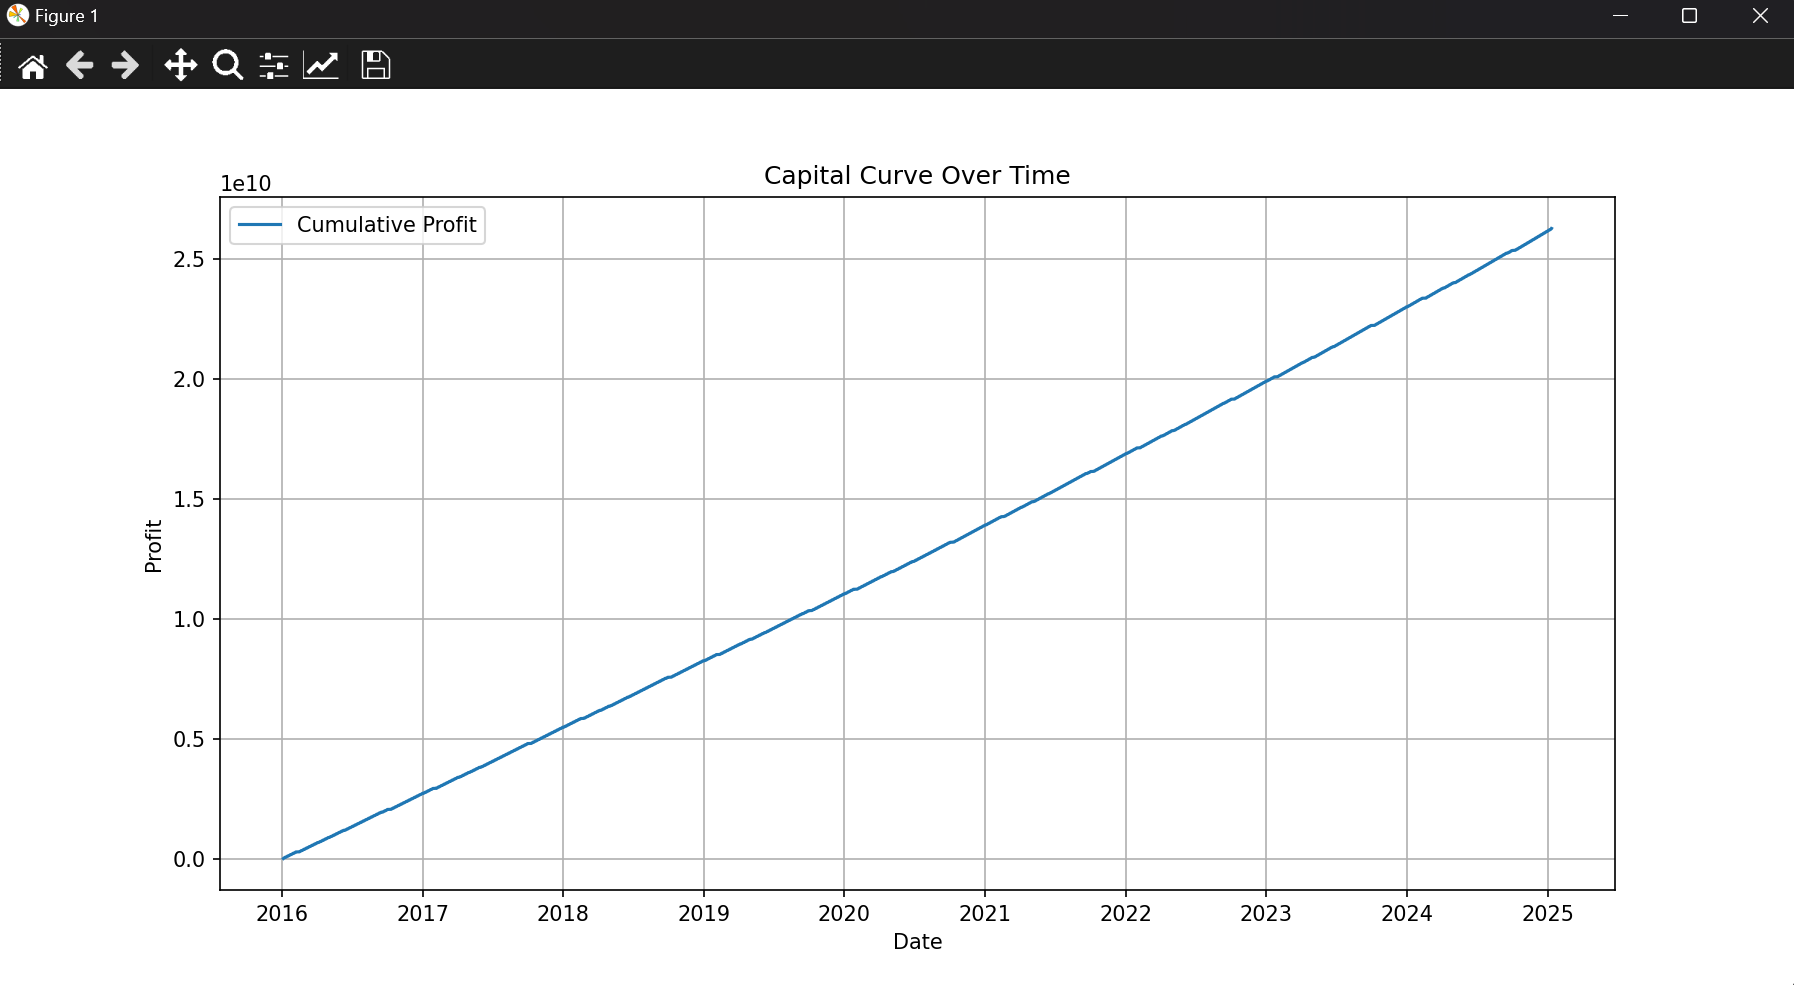
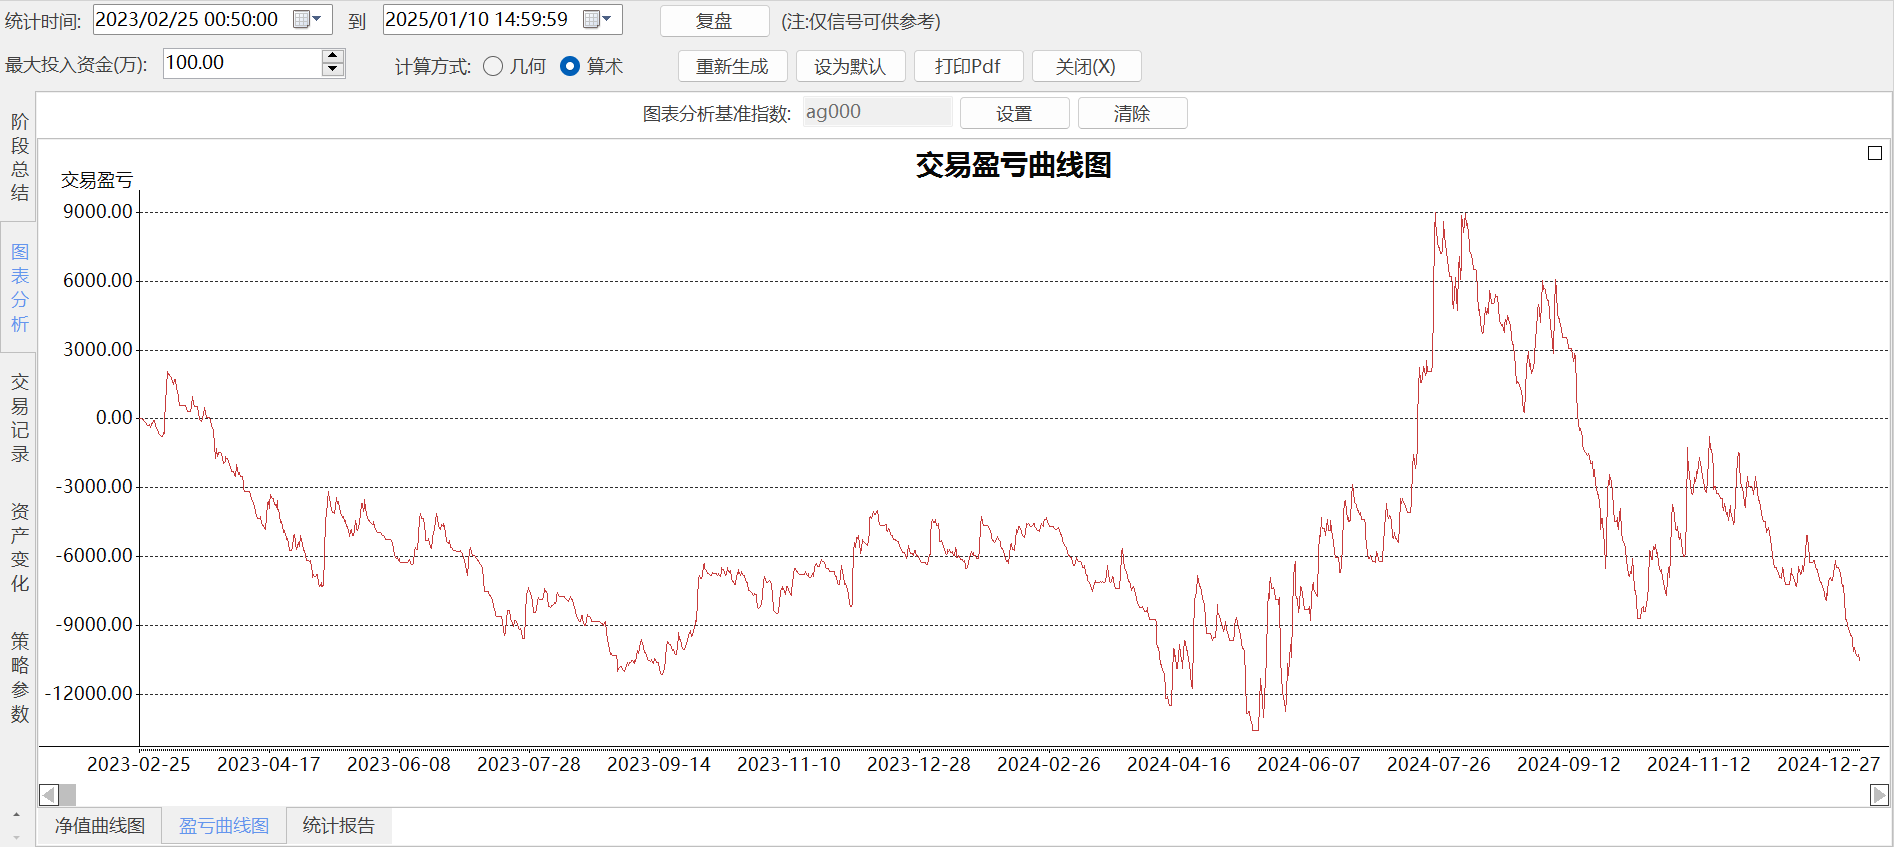
怎么把tbquant上的策略给转换成python代码啊?有大神能详细指点一下吗?生成出来的回测曲线一直跟软件上的完全不符,卡在这里好久了😭
import pandas as pd
import numpy as np
import matplotlib.pyplot as plt

class VolumeWeightedMomentumSys:
    def __init__(self, data, mom_len=5, avg_len=20, atr_len=5, atr_pcnt=0.5, setup_len=5, fixed_size=1):
        self.data = data
        self.mom_len = mom_len
        self.avg_len = avg_len
        self.atr_len = atr_len
        self.atr_pcnt = atr_pcnt
        self.setup_len = setup_len
        self.fixed_size = fixed_size

        # Variables to track
        self.vwm = None  # 成交量加权动量
        self.atr = None  # ATR
        self.se_price = 0  # 当前价格通道
        self.ssetup = 0  # 条件计数器
        self.intra_trade_high = 0
        self.intra_trade_low = 0
        self.position = 0  # 持仓:0为无仓,-1为空单
        self.profits = []  # 用于存储交易盈亏
        self.capital_curve = []  # 资金曲线
        self.current_capital = 100000  # 初始资本
        self.dates = []  # 保存完整的日期

        self.init_indicators()  # 初始化指标

    def init_indicators(self):
        """初始化指标计算"""
        # 计算动量
        momentum = self.data['close'].diff(self.mom_len)
        # 计算成交量加权动量 (VWM)
        vol_momentum = self.data['vol'] * momentum
        self.vwm = vol_momentum.rolling(window=self.avg_len).mean()
        # 计算ATR
        high_low = self.data['high'] - self.data['low']
        high_close = (self.data['high'] - self.data['close'].shift()).abs()
        low_close = (self.data['low'] - self.data['close'].shift()).abs()
        true_range = pd.concat([high_low, high_close, low_close], axis=1).max(axis=1)
        self.atr = true_range.rolling(window=self.atr_len).mean()

    def on_bar(self, bar_index):
        """逐根K线回测逻辑"""
        # 检查是否足够数据初始化
        if bar_index < max(self.avg_len, self.atr_len):
            # 保持资金和日期不变
            self.capital_curve.append(self.current_capital)
            self.dates.append(self.data.index[bar_index])
            return

        # 获取当前K线数据
        bar = self.data.iloc[bar_index]

        # 检查是否有持仓
        if self.position == 0:
            self.intra_trade_high = bar['high']
            self.intra_trade_low = bar['low']

            # 判断空头势
            if self.vwm.iloc[bar_index] < 0:
                self.ssetup = 0
                self.se_price = bar['close']
            else:
                self.ssetup += 1

            # 入场条件
            if self.ssetup <= self.setup_len and self.ssetup >= 1:
                entry_price = self.se_price - (self.atr.iloc[bar_index] * self.atr_pcnt)
                if bar['low'] <= entry_price:
                    # 做空
                    self.position = -1
                    self.entry_price = entry_price
                    self.intra_trade_high = bar['high']
                    print(f"Sell short at {entry_price} on {bar.name}")

        elif self.position == -1:
            # 更新最高价格
            self.intra_trade_high = max(self.intra_trade_high, bar['high'])

            # 出场条件
            if self.vwm.iloc[bar_index] > 0:
                exit_price = bar['open']  # 平仓价为开盘价
                profit = (self.entry_price - exit_price) * self.fixed_size
                self.current_capital += profit  # 更新资金
                self.profits.append(profit)
                self.position = 0
                print(f"Buy to cover at {exit_price} on {bar.name}. Profit: {profit}")

        # 记录资金曲线和日期
        self.capital_curve.append(self.current_capital)
        self.dates.append(bar.name)

    def backtest(self):
        """运行回测"""
        for i in range(len(self.data)):
            self.on_bar(i)

        # 打印总盈亏
        total_profit = sum(self.profits)
        print(f"Total profit: {total_profit}")
        return self.capital_curve, self.dates

# 加载数据
open_data = pd.read_csv(r'C:\Users\User\Desktop\data(min5)\open.csv', index_col=0, parse_dates=True)
close_data = pd.read_csv(r'C:\Users\User\Desktop\data(min5)\close.csv', index_col=0, parse_dates=True)
high_data = pd.read_csv(r'C:\Users\User\Desktop\data(min5)\high.csv', index_col=0, parse_dates=True)
low_data = pd.read_csv(r'C:\Users\User\Desktop\data(min5)\low.csv', index_col=0, parse_dates=True)
vol_data = pd.read_csv(r'C:\Users\User\Desktop\data(min5)\vol.csv', index_col=0, parse_dates=True)

# 将数据合并成一个DataFrame
data = pd.DataFrame({
    'open': open_data['ag'],
    'close': close_data['ag'],
    'high': high_data['ag'],
    'low': low_data['ag'],
    'vol': vol_data['ag'],
}, index=open_data.index)

# 初始化策略
strategy = VolumeWeightedMomentumSys(data)

# 回测
profits, dates = strategy.backtest()

# 绘制资金曲线
plt.figure(figsize=(12, 6))
plt.plot(dates, np.cumsum(profits), label='Cumulative Profit')  # 累积盈亏
plt.xlabel('Date')
plt.ylabel('Profit')
plt.title('Capital Curve Over Time')
plt.legend()
plt.grid()
plt.show()
//------------------------------------------------------------------------
// 简称: VolumeWeightedMomentumSys_S
// 名称: 成交量加权动量交易系统 空
// 类别: 策略应用
// 类型: 内建应用
// 输出:
// 策略说明:
//            基于动量系统, 通过交易量加权进行判断
//
// 系统要素:
//             1. 用UWM下穿零轴判断空头趋势
// 入场条件:
//             1. 价格低于UWM下穿零轴时价格通道,在SetupLen的BAR数目内,做空
//
// 出场条件:
//             1. 多头势空单出场
//         注:
//----------------------------------------------------------------------//
Params
    Numeric MomLen(5);                                                 //UWM参数
    Numeric AvgLen(20);                                             //UWM参数
    Numeric ATRLen(5);                                                 //ATR参数
    Numeric ATRPcnt(0.5);                                             //入场价格波动率参数
    Numeric SetupLen(5);                                            //条件持续有效K线数
Vars
    Series<Numeric> VWM(0);
    Series<Numeric> AATR(0);
    Series<Numeric> SEPrice(0);
    Series<Bool> BullSetup(False);
    Series<Bool> BearSetup(False);
    Series<Numeric> SSetup(0);
Events
    OnBar(ArrayRef<Integer> indexs)
    {


        VWM = XAverage(Vol * Momentum(Close, MomLen), AvgLen);            //定义UWM
        AATR = AvgTrueRange(ATRLen);                                    //ATR
        BullSetup = CrossOver(VWM,0);                                    //UWM上穿零轴定义多头势
        BearSetup = CrossUnder(VWM,0);                                    //UWM下穿零轴定义空头势
        If (BearSetup )                                                 //空头势开始计数并记录当前价格
        {
            SSetup = 0;
            SEPrice = Close;
        }
        Else    SSetup = SSetup[1] + 1;                                        //每过一根BAR计数
        //系统入场
        If (CurrentBar > AvgLen And MarketPosition == 0 ) //当空头势满足并且在SetupLen的BAR数目内,当价格达到入场价格后,做空
        {
            If( Low <=SEPrice[1] - (ATRPcnt * AATR[1]) And SSetup[1] <= SetupLen And SSetup >= 1 And Vol > 0)
            {
                SellShort(0, Min(Open,SEPrice[1] - (ATRPcnt * AATR[1]))) ;
            }
        }
        //系统出场
        If (MarketPosition == -1 And  BarsSinceEntry > 0 And Vol > 0)  //多头势平掉空单
        {
            If( BullSetup[1] == True )
            {
                Buytocover(0,Open);
            }
        }
    }
//------------------------------------------------------------------------
// 编译版本    GS2014.10.25
// 版权所有    TradeBlazer Software 2003-2025
// 更改声明    TradeBlazer Software保留对TradeBlazer平
//            台每一版本的TradeBlazer公式修改和重写的权利
//------------------------------------------------------------------------

python每次跑出来的曲线都差不多长这样的,跟tb上完全不一样😭
